
- YS TECH USA Inc blog
- Thermal Management,
- AI Hardware Cooling,
- Static Pressure & Airflow,
- PQ Curve
- Fan Selection for AI-Enabled Products: Reading a PQ Curve Before You Choose a Part
I've seen this happen more times than I can count. An engineer needs more cooling for an AI module, sorts a catalog by maximum airflow, and picks a part with plenty of margin. Then the prototype runs hot, and I get a call asking what's wrong with the fan.
Usually, nothing is wrong with the fan. It's doing exactly what it was built to do. The trouble is that maximum airflow describes a condition your enclosure will never give you.
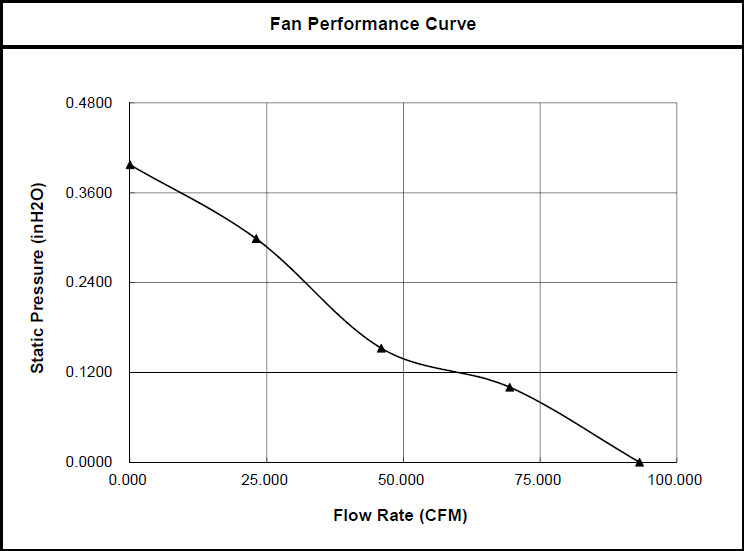
So when an engineer asks me which fan to use, I start with the PQ curve. It shows you what a fan can do once it has to push air through a real product.
What a PQ curve tells you
P is static pressure, and Q is airflow. Start by looking at the two ends of the curve, because neither one is where your fan will live:
- Free delivery: This is where the curve meets the airflow axis. The fan faces no resistance, so airflow is at its maximum.
- Shutoff: This is where the curve meets the pressure axis. Pressure peaks when the test chamber's nozzle is closed, so the fan is moving no air.
Your product operates somewhere in between. Catalog tables typically give you those two endpoints, and the curve gives you everything between them. That's why two fans with the same maximum airflow can perform very differently in the same box.
Your enclosure has a curve too
Engineers tend to think of the fan as the only thing with a curve, but your enclosure has one as well. Heat sink fins, filters, grilles, cable bundles, and tight passages all resist airflow, and together they create your system impedance. In most electronic equipment, static pressure rises with the square of the airflow. If you want twice the air, you need about four times the pressure.
The fan's real performance is set by where your system impedance curve crosses the fan curve. That intersection is your operating point. In a given system, a fan can deliver only one flow at one pressure, so I'd trust that point over any single catalog number.
How I'd read the curve
1. Estimate the airflow you need. A common sea-level approximation is CFM (cubic feet per minute) = 3.16 x watts/temperature rise in °F. If you're dissipating 100 W with an 18°F (10°C) air temperature rise, that's about 18 CFM. Use your worst-case load, and count everything in the enclosure that makes heat, not just the AI module. Treat the result as your minimum, because the module's heat sink may need more local airflow than the overall average suggests.
2. Find your system impedance. You can estimate it early, but measure it as soon as you can, because measurement gives you the most accurate answer. Once you have one good point, the square law gets you a first-pass curve. If your enclosure measures 0.10 inches of water at 18 CFM, expect roughly 0.19 inches at 25 CFM.
3. Overlay the curves and read the intersection. If the fan curve crosses your system curve at or above your target airflow, you have a candidate. If it crosses below, that fan will come up short, no matter what its maximum airflow says.
4. Look at where the operating point sits. Axial fans have a stall region where airflow becomes unstable, and the curve slope changes sharply. Keep your operating point on the higher-airflow side of that region, which helps reduce both noise and power consumption. And leave yourself some room. A clogged filter or a late design change can push you toward stall.
5. Check every speed you plan to run. AI workloads spike, so most designs vary fan speed with pulse width modulation (PWM). Each speed has its own curve, while your system curve stays put. Airflow changes with speed, pressure with the square of speed, and power with the cube. Your operating point has to work at idle and at peak.
What extra speed costs you
Here's a real example from our Xtreme Series, using two 12V fans that are both 60 x 38mm:
|
Specification |
XYW06038012BL |
XYW06038012BS |
|
Speed |
4,500 RPM |
7,500 RPM |
|
Maximum airflow |
26.7 CFM |
45.5 CFM |
|
Static pressure |
8.1 |
22.9 |
|
Power |
2.28 W |
8.64 W |
|
Noise |
41 dB |
55 dB |
|
L10 life at 40°C |
80,000 hours |
65,000 hours |
With the faster part, you get about 70% more maximum airflow and nearly three times the static pressure. You also take on almost four times the power, 14 dB more noise, and a shorter rated life. L10 is the point at which 10% of a fan population is expected to have failed.
If your product needs that pressure, it's a good trade, and I'd make it. If it doesn't, you're paying for performance you'll never use.
When the curve tells you to change the design
Sometimes no fan in your envelope reaches the airflow you need. Here's what I'd look at next.
Reduce the impedance. I'd start here, before adding fans or going to a larger one. A more open fin pitch or a larger vent can open up a quieter, lower-power part.
Use a blower. Axial fans generally suit high airflow at low static pressure, while centrifugal fans deliver less airflow against higher pressure. If your compact edge AI design has narrow ducted paths, consider our DC and electronically commutated (EC) blowers.
Add a fan, but match the arrangement to the impedance. Parallel fans double airflow only at free delivery, so they work best in low-impedance systems. Series fans do best in high-impedance systems, and they don't double performance across the whole curve either. Combined curves can also have unstable areas, so test any multiple-fan layout in the lab.
Account for altitude. A fan moves about the same volume of air at altitude, but less mass, so its cooling falls as air density drops. If your product is headed somewhere high, size it for those conditions, not just your lab.
Standard part or custom design
Most of the time, the answer is a part from our standard range, and the curve will confirm it quickly. Some AI-enabled products won't have a catalog fan that crosses the system curve in the right place within the size, noise, or power limits. When that happens, our engineering team can model your enclosure with Computational Fluid Dynamics (CFD), modify a standard part, or move to a custom design.
If you're working with NVIDIA Jetson or Intel Core Ultra hardware, our guide on selecting a fan and heat sink for AI inference hardware covers the rest.
Bring us your thermal challenge, or browse our standard range. We do both.
FAQ: Reading a PQ Curve for AI-Enabled Products
What is a PQ curve?
A PQ curve plots a fan's static pressure (P) against its airflow (Q). It shows how much air the fan can move at each resistance level.
Why can't I select a fan by its maximum airflow?
Maximum airflow is measured with no resistance. Your enclosure, heat sink, and filters all add resistance, so the fan will deliver less inside your product.
What is a fan's operating point?
It's where the fan curve crosses your system impedance curve. That point shows the airflow and pressure the fan will actually deliver in your product.
Should I use an axial fan or a blower for an edge AI enclosure?
Axial fans generally suit higher airflow at lower pressure, while blowers suit restricted paths that need more pressure. Compare each operating point in your enclosure.
What should I do if the operating point is in the stall region?
Reduce the system impedance or choose a fan or blower with more pressure capability. Then check the new operating point at every speed you plan to run.
Sources: